Economics Graphs Flashcards: Learn Shifts, Not Just Shapes
Economics exams test whether you can say which curve shifts, which way, and what happens to price and quantity. How to card supply and demand, AD/AS and market structure graphs with draw-it and scenario cards.
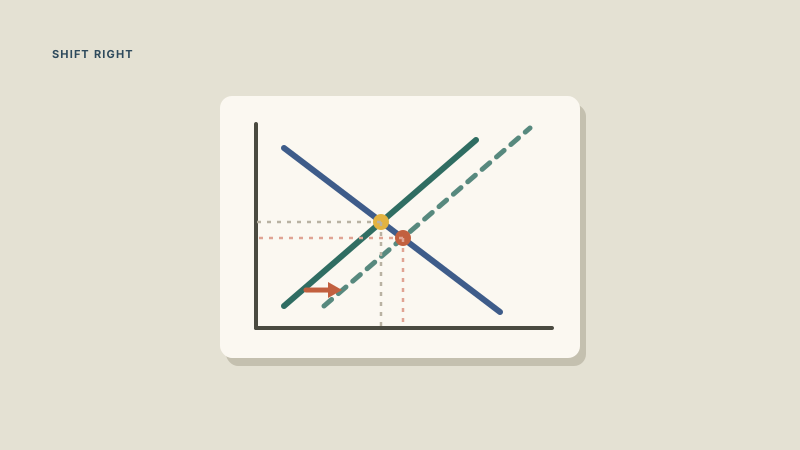
Most economics exam questions about graphs do not ask what a graph looks like. They give you an event (a frost destroys orange crops, the central bank raises interest rates) and ask which curve shifts, in which direction, and what happens to price and quantity. So the useful economics card is not "draw the supply and demand graph." It is a scenario on the front and the shift plus outcome on the back, practiced until it is automatic, plus a small set of "draw it" cards for the graphs you must reproduce. That works for intro micro and macro, AP Economics, and A level.
(This guide is from the Nebulearn blog, and Nebulearn makes a flashcard app with image cards, which suit graph practice.)
The question behind every graph
For any event, the same four steps decide the answer:
| Step | Question | Example: a frost destroys much of the orange crop |
|---|---|---|
| 1 | Which market or model? | The market for oranges |
| 2 | Which curve is affected? | Supply (a producer side event) |
| 3 | Which direction? | Left (less supply at every price) |
| 4 | What happens to the equilibrium? | Price rises, quantity falls |
Card those four steps once as a procedure card, and then practice them through many scenario cards.
Shift vs movement along the curve
The most common mistake in intro economics is confusing a shift of a curve with a movement along it.
| What changes | Effect | Example |
|---|---|---|
| The good's own price | Movement along the curve (change in quantity demanded or supplied) | Oranges get cheaper, people buy more oranges |
| Any other determinant | Shift of the whole curve (change in demand or supply) | Incomes rise, demand for normal goods shifts right |
Make one comparison card for this distinction with a pair of examples, and grade yourself strictly on the wording (honest grading matters, as stop hitting Easy on flashcards explains): "demand increased" vs "quantity demanded increased" is often worth marks.
Determinants: card them as scenarios
| Curve | Determinants (shift factors) |
|---|---|
| Demand | Income (normal vs inferior goods), prices of related goods (substitutes, complements), tastes, expectations, number of buyers |
| Supply | Input costs, technology, prices of related goods in production, expectations, number of sellers, taxes and subsidies |
Card each determinant through a scenario, not a list:
Front: The price of coffee rises. What happens in the market for tea?
Back: Tea is a substitute, so demand for tea shifts right. Price and quantity of tea both rise.
Front: A new machine cuts the cost of producing smartphones. Which curve, which way, and the result?
Back: Supply shifts right. Price falls, quantity rises.
Write several scenarios per determinant so you learn the logic, not the example. Case study flashcard encoding covers writing good scenario cards.
The graphs worth a "draw it" card
Some graphs you must be able to draw from memory with every label correct. Use a draw-it card: the front names the graph, you draw it on paper, then compare with the image on the back.
| Graph | What must be on it |
|---|---|
| Supply and demand | Axes (price, quantity), both curves, equilibrium, a shift with new equilibrium |
| Price ceiling and floor | Ceiling below equilibrium causing shortage, floor above causing surplus |
| Tax incidence and deadweight loss | Tax wedge, consumer and producer burden, deadweight loss triangle |
| Production possibilities frontier | Bowed out curve, points inside, on and outside, a shift outward from growth |
| Perfect competition (firm and market) | Price equals marginal revenue, profit maximization where MR equals MC |
| Monopoly | Marginal revenue below demand, output where MR equals MC, price from demand curve, deadweight loss |
| Aggregate demand and aggregate supply | Short run and long run aggregate supply, equilibrium output and price level |
| Money market | Money supply vertical, money demand downward, nominal interest rate |
| Phillips curve | Short run trade off, long run vertical at the natural rate |
Drawing from memory is a much stronger retrieval than recognizing a picture. Dual coding explains why combining the drawing with words helps.
Macro chains
Macro questions often ask about chains of effects. Card them as short sequences, one chain per card:
Front: The central bank buys bonds (expansionary monetary policy). Chain of effects?
Back: Money supply rises, interest rates fall, investment and spending rise, AD shifts right, output and price level rise in the short run.
Common chains worth cards: expansionary and contractionary fiscal policy, expansionary and contractionary monetary policy, a supply shock, and the effect of an interest rate change on exchange rates and net exports.
Common mistakes to card as rules
| Mistake | Correct rule |
|---|---|
| A price change shifts the demand curve | A price change moves along the curve |
| A price ceiling above equilibrium causes a shortage | A ceiling only binds below equilibrium |
| Monopoly sets price where MR equals MC | It sets output where MR equals MC, then price from the demand curve |
| AD shifts when the price level changes | That is a movement along AD |
| Inferior goods have negative demand | Demand for inferior goods falls as income rises |
Schedule
| When | What |
|---|---|
| During each unit | Scenario cards for each new determinant or policy, 5 to 10 a class |
| After each unit | Draw-it cards for that unit's graphs |
| Weekly | Mixed review across all units |
| Before the exam | Practice free response questions, drawing graphs under time |
Mixing micro and macro scenarios in review helps you choose the right model, which is step one on every question. Studying two subjects with interleaving explains why mixing helps.
Where other resources are better
Practice free response questions, especially past AP or course exams with marking schemes, show exactly which labels and explanations earn points. Textbooks and well known video series explain the models. Drawing graphs repeatedly on paper is irreplaceable, since cards can prompt the drawing but your hand has to do it.
Flashcards vs practice problems covers when to use each. In Nebulearn, you can put graph images on the back of draw-it cards and use image occlusion to hide labels on a graph, and FSRS brings back the scenarios you get wrong.
Scenario, curve, direction, outcome
Economics graph questions are about shifts and their effects. Card the four step procedure, practice it with many scenarios per determinant, card the double shift cases and macro chains, and use draw-it cards for the graphs you must reproduce. Grade the wording strictly, mix units in review, and draw graphs on paper often.